
Every public company moves through five phases: startup, hyper growth, operating leverage, capital return and decline. The phase determines which metrics matter and which valuation methods work. Judging a hyper-growth company on profitability, or a capital-return company on revenue growth, is the most common analytical error in investing.
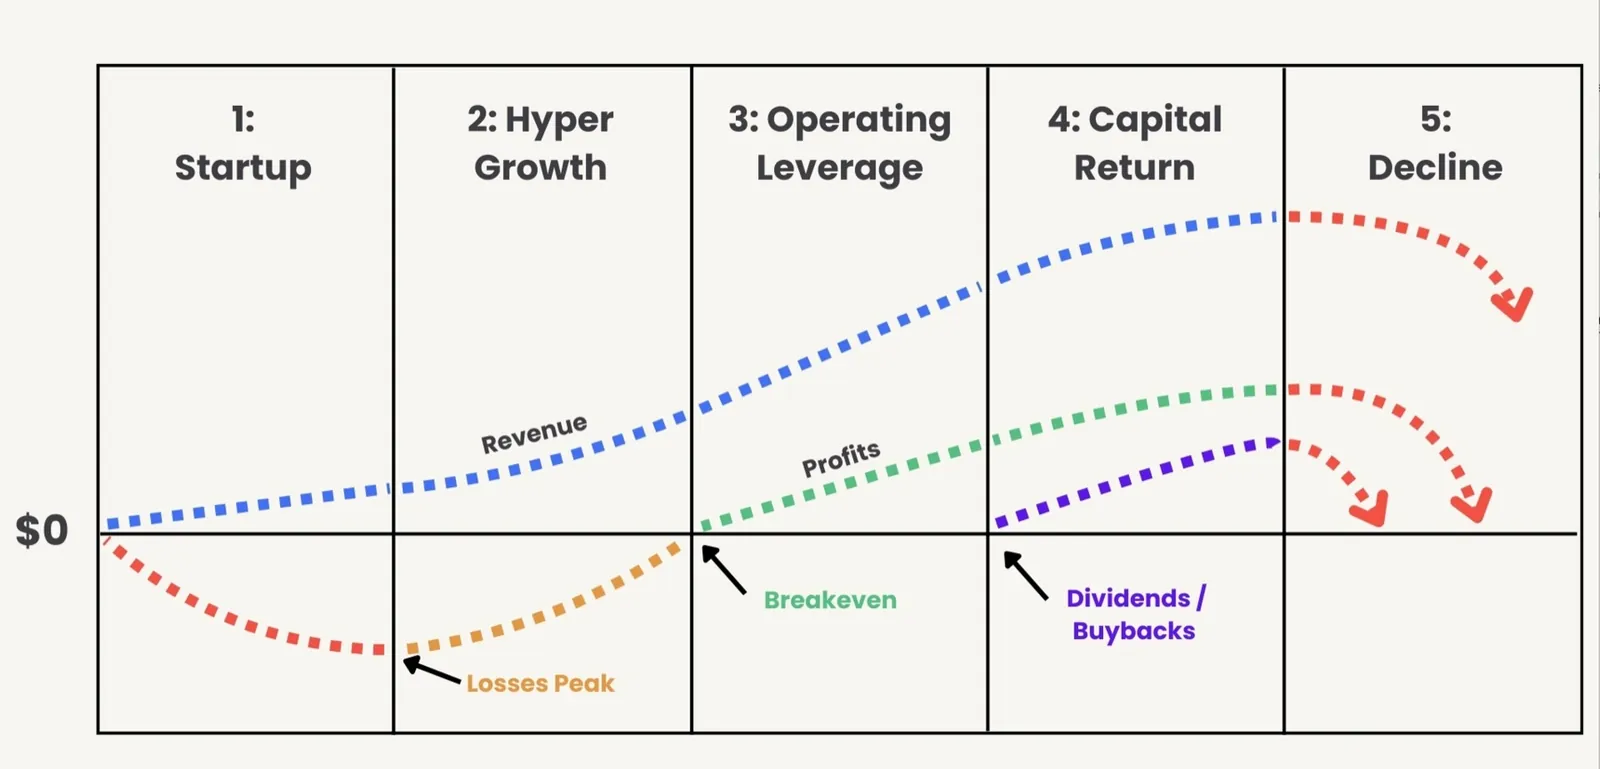
Read the chart as two lines. Revenue climbs from nothing, flattens as the market fills up, and rolls over in decline. Profit starts deeply negative, bottoms out early in hyper growth, crosses zero at breakeven, and peaks a phase later than revenue does. The gap between those two lines is the whole story: it explains why a company can be growing quickly and losing money, or barely growing and generating more cash than it knows what to do with.
The five phases
Startup
The company is spending more than it earns to build a product and find a market. Revenue is small and lumpy, losses deepen as it hires and invests, and the outcome turns on whether anyone genuinely wants what it sells. Most companies pass through this phase privately, which is why public-market investors rarely see it.
What good looks like: revenue growing off a small base, gross margin moving in the right direction, and a cash runway long enough to reach the next milestone without a dilutive raise.
How to value it: cash-flow methods do not work, because there are no reliable cash flows to discount. Total addressable market and price to sales are the only tools that carry information, and both measure a story rather than a business.
Hyper Growth
Revenue accelerates. The product has found its market and the company spends aggressively to take as much of it as possible. Losses usually peak in this phase and then begin narrowing, which is the signal that the model works. Share count often rises, because stock-based compensation is funding the hiring.
What good looks like: revenue growth well above the industry, gross margin stable or expanding as the company scales, customers spending more each year rather than less, and losses shrinking as a share of revenue.
How to value it: price to sales and price to gross profit are the workable multiples. Earnings multiples are meaningless, because earnings are negative by design. A reverse DCF is useful as a check on what the current price already assumes about the future.
Operating Leverage
Profits appear. Revenue now grows faster than costs, so each additional dollar of sales drops disproportionately to the bottom line and margins expand year after year. Breakeven happens at the start of this phase. It is often the most rewarding phase to own, because profitability arrives while growth is still high.
What good looks like: profit growing faster than revenue, operating margin expanding, free cash flow turning positive and then compounding, and dilution slowing.
How to value it: forward earnings and forward free cash flow multiples begin to work. Trailing multiples still look expensive, because the earnings base is small and rising fast, which is exactly when a trailing figure is least informative.
Capital Return
The company is mature and cash-rich. Growth slows because the market is largely captured, and management can no longer reinvest everything it earns at attractive returns. So it hands cash back through dividends and buybacks, or buys growth through acquisitions.
What good looks like: high and stable return on invested capital, free cash flow that comfortably covers the dividend, a share count that falls rather than rises, and acquisitions that earn more than they cost.
How to value it: this is where valuation is most reliable. Trailing and forward earnings multiples, free cash flow multiples, discounted cash flow and reverse DCF all work here, because the cash flows are large, predictable and durable enough to model.
Decline
Revenue and profits fade as demand shifts, technology moves on, or competitors take share. Decline can be slow and profitable for years, which is what makes it dangerous: the numbers look cheap while the business underneath keeps shrinking. The hardest judgement in investing is whether a decline is cyclical and will reverse, or structural and will not.
What good looks like: there is no version of this phase that is good on its own terms. What matters is whether the balance sheet can outlast the decline, whether the assets are worth more than the market says, and whether management is returning cash rather than spending it defending a losing position.
How to value it: cash-flow multiples mislead, because they extrapolate earnings that are falling. Asset-based measures and a wide margin of safety take over, which is the approach Benjamin Graham built a career on.
Which valuation method works in each phase
Valuation methods are not universally right or wrong. They are right or wrong for a given phase, because each one depends on inputs that only exist at certain points in a company's life. This is the matrix that follows from that.
| 1. Startup | 2. Hyper Growth | 3. Operating Leverage | 4. Capital Return | 5. Decline | |
|---|---|---|---|---|---|
| Source of value | Product and market fit | Revenue growth | Margin expansion | Dividends, buybacks, M&A | Asset sales |
| Total addressable market | Useful | Useful | Somewhat useful | Not useful | Not useful |
| Price to sales | Useful | Useful | Useful | Somewhat useful | Not useful |
| Price to gross profit | Somewhat useful | Useful | Useful | Somewhat useful | Not useful |
| Price to forward earnings | Not useful | Not useful | Useful | Useful | Not useful |
| Price to forward free cash flow | Not useful | Not useful | Useful | Useful | Not useful |
| Price to trailing earnings (P/E) | Not useful | Not useful | Somewhat useful | Useful | Not useful |
| Price to trailing free cash flow | Not useful | Not useful | Somewhat useful | Useful | Not useful |
| Discounted cash flow | Not useful | Not useful | Somewhat useful | Best fit | Not useful |
| Reverse DCF | Not useful | Not useful | Somewhat useful | Best fit | Not useful |
On the decline column. Every cash-flow method reads as not useful there for the same reason: they all extrapolate earnings that are falling, so they flatter a business that is shrinking. What replaces them is asset value. Book value, replacement cost and what the pieces would fetch if sold separately become the relevant questions, alongside a margin of safety wide enough to survive being wrong about how fast the decline runs.
How to tell which phase a company is in
Three numbers place most companies in under a minute.
- The revenue growth rate over three to five years, and whether it is accelerating or slowing. One year tells you about the comparison, not the trend.
- The operating margin and its direction. Negative and deepening, negative and improving, positive and expanding, or positive and flat are four different phases.
- What the company does with cash. Raising it, reinvesting all of it, reinvesting some of it, or handing it back.
A company growing 40% with negative margins and a rising share count is in hyper growth. One growing 4% with a 30% margin, a dividend and a shrinking share count is in capital return. The ambiguous cases are usually companies at a boundary, and those are the ones worth the most attention, because the market often still prices them for the phase they are leaving.
Check any company's phase in seconds
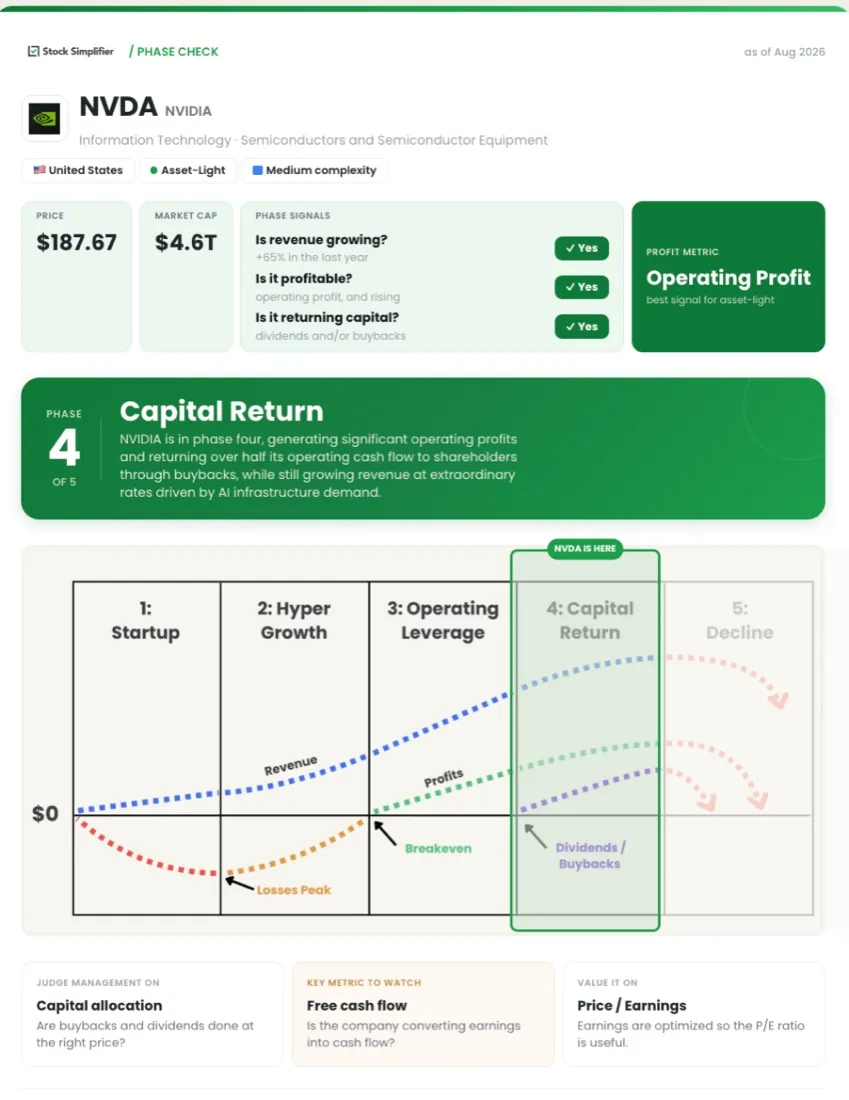
Enter a ticker and Phase Check reads the financials to place the company on this exact curve, then tells you which metric to watch, how to judge management, and which valuation method fits. It is the three-number test above, run for you.
Try Phase Check freeNo credit card. One check without an account, unlimited with a free one.
The mistake this framework prevents
Almost every confident but wrong conclusion about a stock comes from applying one phase's standards to a company in another. A hyper-growth company gets dismissed because it has no earnings, when earnings are not what that phase produces. A utility gets criticised for slow revenue growth, when growth is not what it exists to deliver. A declining business looks like a bargain at six times earnings, right up to the point where the earnings are gone.
Establishing the phase first turns those from judgement calls into a checklist. It tells you which numbers to read, what good looks like when you read them, and which valuation method will give you an answer worth trusting.
The investors who mastered each phase
One reason the phases are worth learning is that the great investors are not generalists. Each built a method suited to one part of the curve, which is why their advice sounds contradictory until you know which phase they were talking about.
- Startup: Marc Andreessen, backing a bold idea before it is proven.
- Hyper growth: David Gardner, riding the rule-breakers as they scale.
- Operating leverage: Peter Lynch, profitable growth you can understand.
- Capital return: Warren Buffett, wide-moat compounders that pay you.
- Decline: Benjamin Graham, bargains and turnaround potential.
Buffett's insistence on predictable earnings and Andreessen's willingness to fund a company with no revenue are not opposing philosophies. They are the correct approach to two different phases.
Frequently asked questions
Related
- Phase Check, find the phase of any company in seconds
- How to analyze a stock, the seven-step framework the phase question sits inside
- How to read an income statement, the five numbers that place a company on this curve
- When to sell a stock, including what a phase change means for a position you own
- Investing glossary, plain-English definitions of every term used above