
The Rule of 40 is a guideline for software companies: revenue growth rate plus profit margin should be at least 40%. It captures the trade-off between growing fast and being profitable, allowing low margins if growth is high, or slow growth if margins are strong. Either is fine. Neither is not.
What it is really testing
Software companies can buy growth. Spend enough on sales and marketing and revenue will rise, whether or not the underlying business deserves it. The Rule of 40 exists to price that trade honestly: you may run negative margins, provided the growth you bought with them is large enough to justify the spending.
A company growing 60% with a margin of minus 20% scores 40 and passes. So does one growing 10% with a 30% margin. Both are coherent strategies. A company growing 15% with a minus 10% margin scores 5, and the question that follows is what exactly the money is being spent on.
Worked example
Three companies, each measured on free cash flow margin.
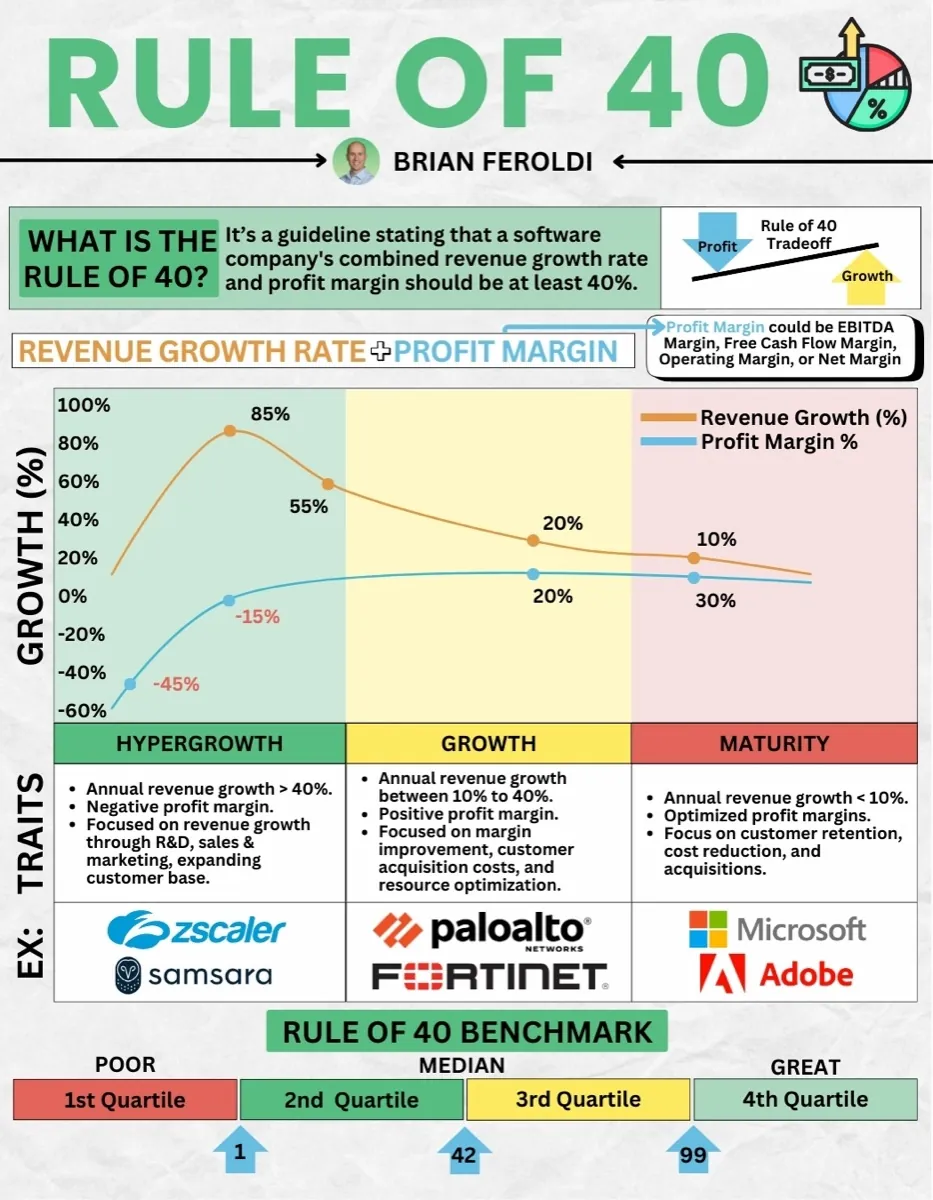
Hypergrowth: 85% growth + (−45%) margin = 40 pass
Growth: 20% growth + 20% margin = 40 pass
Maturity: 10% growth + 30% margin = 40 pass
All three score identically and are completely different businesses at different points in their lives. That is the rule working as intended: it is a test of coherence, not of quality.
Which margin to use
The rule does not specify, which is its biggest practical weakness. Companies pick the definition that flatters them, and EBITDA margin is the most flattering because it excludes stock-based compensation, which for software is an enormous real cost paid in shareholder ownership.
Free cash flow margin is the most honest choice for an outside investor, and operating margin is a reasonable second. Whichever you pick, apply it consistently across every company you compare, and be suspicious when a company quotes its own Rule of 40 score without saying which margin it used.
What a good score looks like
Forty is the pass mark, not the target. In practice the distribution matters more than the threshold: scores cluster low, so consistently exceeding 40 puts a company well into the upper part of the field, and a score above 60 is genuinely rare.
Consistency counts for more than any single reading. A company that scores 55 one year and 20 the next has not demonstrated anything except volatility. Four or five years above 40 says the economics are structural.
Where the rule stops working
- Outside software. It was built for businesses with high gross margins and low marginal costs. Applying it to a manufacturer or a retailer produces a number with no meaning, because the growth and margin trade-off works completely differently there.
- Very early companies. A company growing 200% off a tiny base will pass while burning cash at a rate that makes the score irrelevant. The rule assumes a revenue base large enough for the percentages to describe something.
- It ignores quality of growth. Revenue bought through acquisitions counts the same as revenue won organically. So does revenue from customers who will churn next year. Check net revenue retention alongside the score.
- It ignores the balance sheet. A company passing at 40 while running out of cash is still running out of cash.
The rule across three stages of a software company
The same score of 40 describes three completely different companies. This is what each one looks like, with the traits and public examples of each, and where the benchmark quartiles fall.
The Rule of 40 is really a phase question
Hypergrowth, growth and maturity in this graphic map onto the lifecycle phases, and the score means something different in each. Phase Check places any of 10,000+ global stocks on that curve and names the metric that matters most where it sits.
Try Phase Check freeNo credit card. One check without an account, unlimited with a free one.
Frequently asked questions
Related
- Operating leverage, why margins expand as a software company scales
- Gross margin, the line the whole rule depends on
- The 5 lifecycle phases, hypergrowth, growth and maturity, in full
- Investing glossary, every term used above, defined in plain English