
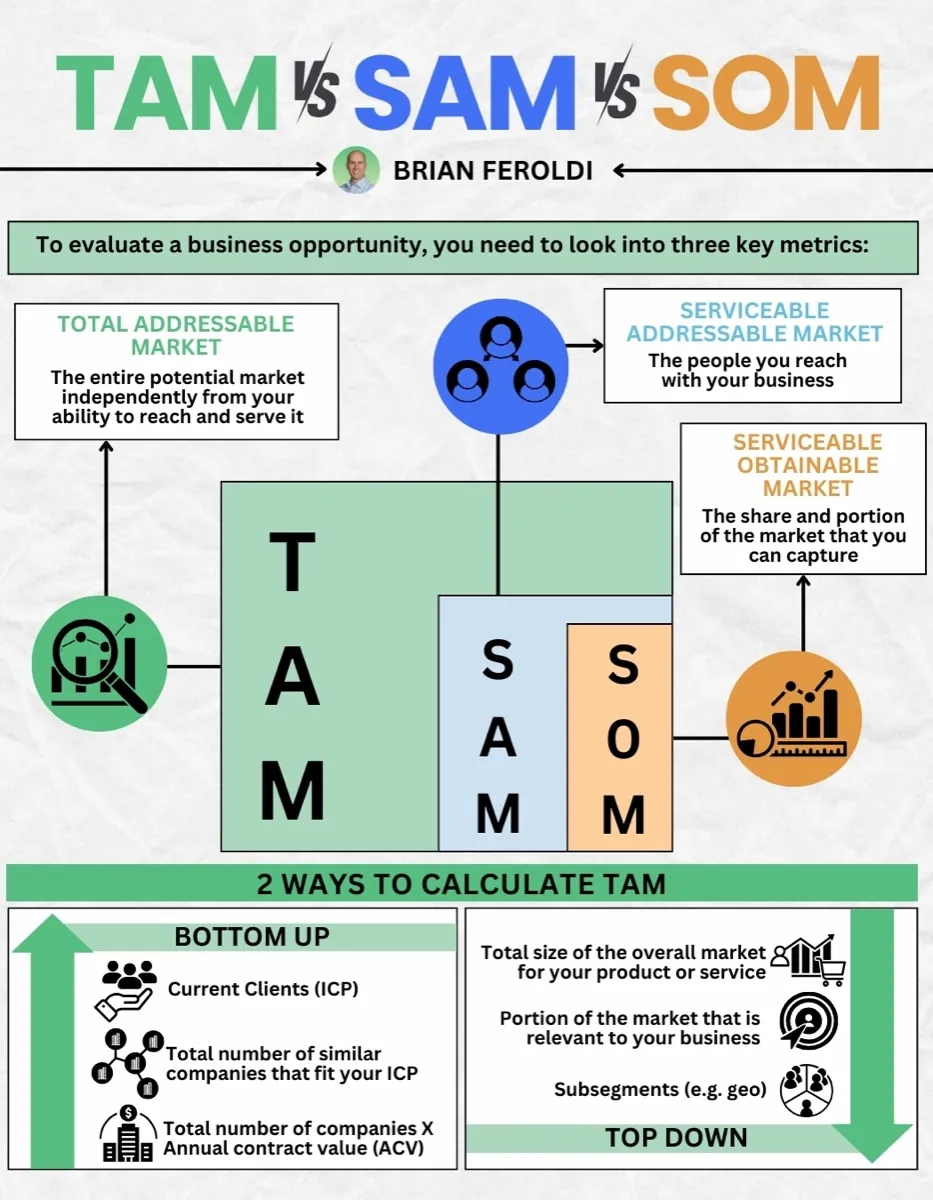
TAM, SAM and SOM are three progressively narrower measures of market size. Total addressable market is the entire market regardless of whether a company could ever reach it. Serviceable addressable market is the part its model can actually serve. Serviceable obtainable market is the share it can realistically capture.
Why three numbers instead of one
Because one number invites dishonesty. A company selling accounting software to small businesses can claim the global software market, the accounting software market, or the small-business accounting software it can realistically win in the countries where it operates. All three are defensible sentences. Only the last one describes the opportunity.
The three-layer framing forces the narrowing to happen in public. TAM is the ceiling nobody reaches. SAM subtracts what the business model cannot serve: wrong geography, wrong segment, wrong price point. SOM subtracts competitors, distribution limits and the time it takes to win anything.
Two ways to calculate TAM, and only one is trustworthy
Top down starts with a published industry figure and cuts it into portions. It is fast, it produces impressive numbers, and it is nearly impossible to check, because the assumptions doing the work are the percentages applied to somebody else's estimate.
Bottom up starts from the customer: how many organisations fit the ideal profile, and what does each one pay a year? Multiply. It produces smaller and more defensible numbers, and every input is something a sceptical reader can challenge.
Worked example
The same company, sized both ways.
Top down: $500B software market × 4% accounting
× 30% small business = $6.0B
Bottom up: 60,000 firms fitting the profile
× $6,000 a year = $360M
A sixteen-fold gap, from the same business. When a company quotes only the larger figure, the gap is what it is choosing not to discuss.
How to read a TAM claim in a filing
- Who produced the number? A commissioned industry report is a marketing document. A bottom-up build from customer counts is an argument.
- Does the company's revenue make sense against it? A business doing $50M in a market it calls $80B has either found something extraordinary or drawn the boundary far too wide. Look at years of history: if the share has not moved, the boundary is the problem.
- Has the TAM grown as growth slowed? The most reliable tell in investor communications. A company approaching the edge of its market frequently rediscovers a larger one.
- Does the price point appear anywhere? A market sized in users rather than dollars is avoiding the question of what anyone will pay.
Where it matters, and where it does not
Market size is one of the few tools that carries real information about an early company, which is exactly why it is abused there. For a business in startup or hyper growth, the size of the prize is much of the thesis, since there are no earnings to value.
For a mature company it matters much less. A business in capital return has already captured most of what it will, and its returns come from free cash flow and what management does with it. A large TAM in that phase is usually a story told to make slowing growth sound temporary.
The three markets, and two ways to size them
How the three nest inside each other, and the bottom-up and top-down calculations side by side so the difference in what each one assumes is visible.
Market size matters most in one phase
TAM is much of the thesis for an early company and mostly a story for a mature one. Phase Check places any of 10,000+ global stocks on the lifecycle, so you know whether the market-size argument is the one to be weighing at all.
Try Phase Check freeNo credit card. One check without an account, unlimited with a free one.
Frequently asked questions
Related
- The 5 lifecycle phases, why market size matters early and not later
- Economic moat, what decides how much of a market a company keeps
- Intrinsic value, where the market-size estimate eventually lands
- Investing glossary, every term used above, defined in plain English