
Return on invested capital, or ROIC, measures how much operating profit a company generates for every dollar of capital put into the business. It is after-tax operating profit divided by invested capital. A ROIC durably above the company's cost of capital is what creating value actually means.
NOPAT = EBIT × (1 − tax rate) · Invested capital = total debt + equity − non-operating cash
Why ROIC and not ROE
Return on equity is the more familiar number and the more easily gamed one. Because equity sits in the denominator, a company can raise ROE simply by borrowing money and buying back stock. Nothing about the business improved; the denominator just got smaller. Two companies with identical operations can report ROEs of 12% and 30% purely because one is leveraged.
ROIC closes that door by putting debt and equity together in the denominator. It asks a question the capital structure cannot flatter: given every dollar the business uses, from any source, how much profit comes back? That is why ROIC travels across industries and balance sheets in a way ROE does not.
How to calculate it
Take operating profit (EBIT) from the income statement and tax it at the company's effective rate to get NOPAT. Then build invested capital from the balance sheet: total debt plus shareholders' equity, minus cash that is not needed to run the business. Divide the first by the second.
Worked example
A company reports $500M of operating profit at a 21% effective tax rate. Its balance sheet shows $1,200M of total debt, $2,000M of equity, and $400M of cash beyond what operations require.
NOPAT = $500M × (1 − 0.21) = $395M
Invested capital = $1,200M + $2,000M − $400M = $2,800M
ROIC = $395M ÷ $2,800M = 14.1%
Every dollar deployed in this business returns just over fourteen cents a year, before growth.
What counts as a good ROIC
The only benchmark that matters is the company's own cost of capital, which for most established businesses sits somewhere around 8% to 10%. Above that line the company creates value as it grows. Below it, growth destroys value: every additional dollar invested returns less than it cost to raise, so a fast-growing company with a 6% ROIC is busy making itself smaller in economic terms while the revenue line goes up.
As rough calibration, a durable ROIC above 15% marks a genuinely good business, and above 25% usually means a real economic moat is present, because ordinary competition drives returns toward the cost of capital. The word doing the work in both sentences is durable. One strong year proves nothing.
Read the trend, not the number
A single ROIC figure is a snapshot of a business at one moment, distorted by whatever happened that year. Five to ten years of ROIC is a portrait. Rising ROIC while revenue grows is the strongest combination in investing: the company is getting more efficient at exactly the moment it is getting bigger, which is what operating leverage looks like on the balance sheet.
Falling ROIC through a growth phase is the warning most investors miss, because revenue is still rising and the story still sounds good. It usually means the company has run out of high-return places to put money and is now buying growth at prices that will not pay off.
Four ways ROIC misleads
- Acquisitive companies look worse than they are, or better. Goodwill from acquisitions sits in invested capital, which depresses ROIC. Excluding goodwill flatters serial acquirers by pretending the purchase price was free. Calculate it both ways and the gap tells you how much of the business was bought rather than built.
- Asset-light businesses can post absurd numbers. A software company with almost no capital employed can show a ROIC of 60% or more. That is real, but it also means the metric has little discriminating power in that industry, so compare against direct peers rather than the market.
- Early-phase companies produce nonsense. Negative operating profit divided by capital gives a negative ROIC that says nothing except that the company is investing. The metric only starts working once profits do.
- Definitions vary. Data providers treat leases, cash and goodwill differently, so two screeners will give you two ROICs for the same company. Pick one method and apply it consistently rather than comparing numbers from different sources.
ROIC changes meaning by lifecycle phase
In startup and hyper growth the number is negative or meaningless and should be ignored. In operating leverage it should be climbing, and a company whose ROIC is not improving as it scales may never earn its cost of capital. In capital return, a high and stable ROIC is the whole thesis, and the question shifts to whether management can keep reinvesting at that rate or should be handing the cash back instead. In decline, ROIC falls toward and then through the cost of capital, which is usually visible in the numbers well before it is admitted in the commentary.
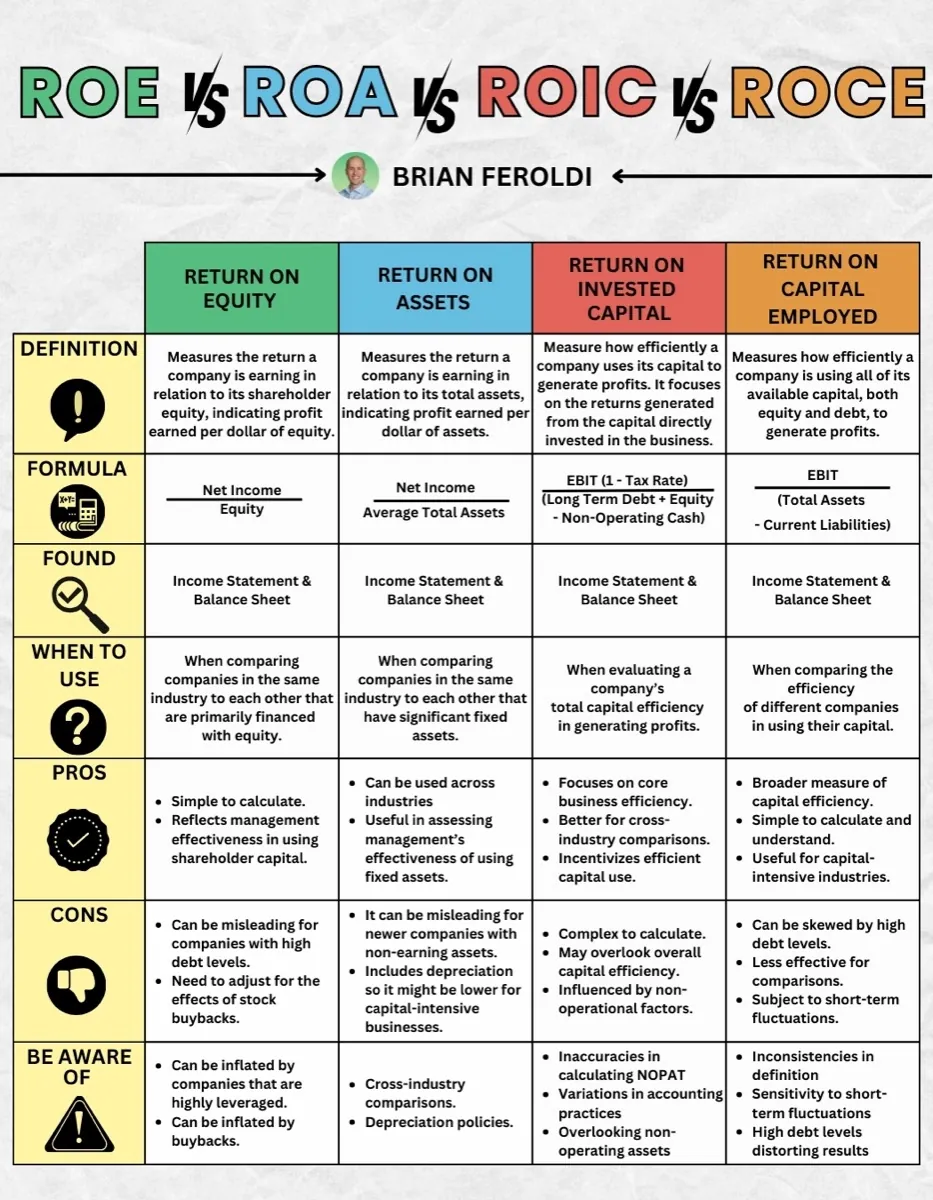
ROIC against the three metrics it is confused with
ROE, ROA, ROIC and ROCE all divide a profit figure by a capital figure, and they answer different questions. This is each one's formula, when it is the right tool, and what distorts it.
See ROIC in the context that makes it readable
A ROIC of 9% means something different in operating leverage than it does in capital return. Phase Check places any of 10,000+ global stocks on the lifecycle and names the metric that matters most at that phase, so you know whether ROIC is the number to judge it on at all.
Try Phase Check freeNo credit card. One check without an account, unlimited with a free one.
Frequently asked questions
Related
- Investing glossary, every term used above, defined in plain English
- Economic moat, why a high ROIC persists, or does not
- Free cash flow, the cash that a high ROIC eventually produces
- The 5 lifecycle phases, when ROIC is the right metric and when it is noise