
An income statement runs from what customers paid at the top to what owners kept at the bottom. Most of the lines in between are noise in any single year. Five of them are not, and reading those five in order tells you most of what the statement has to say about whether the business is getting better or worse.
The steps
Start with revenue, and check the growth rate
Divide this year's sales by last year's. Companies are either growing or shrinking; there is no steady state. A durable business generally grows revenue at least in the mid single digits. Check three to five years rather than one, because a single strong year usually reflects the comparison it is measured against rather than the business itself.
Read gross margin, not just gross profit
Subtract the cost of goods sold from revenue, then divide by revenue. Gross margin measures what the company keeps from each sale before overheads, and it is the clearest evidence of pricing power the statement offers. Stable or rising gross margin through a period of cost inflation means customers accepted higher prices. Falling gross margin usually means they did not.
Compare profit growth to revenue growth
This is operating leverage. If operating profit grows faster than revenue, fixed costs are being spread across a larger base and each additional dollar of sales is worth more than the last. If profit grows more slowly than revenue, the company is buying its growth. The gap between the two rates tells you more than either number alone.
Check what the debt costs
Divide interest expense by operating income. A useful rule of thumb is that it should sit under 25%. Above that, a large share of what the business earns belongs to lenders before it reaches owners, and a weak year stops being an earnings problem and starts being a solvency one.
Finish at the share count, not net income
Net income is what the company earned. What you own is a slice of it, and that slice shrinks when the count rises. Compare diluted shares outstanding this year against last year. Under 1% growth is normal for a slow grower and under 3% for a fast one. Persistent growth above that means stock-based compensation is transferring value from shareholders to employees.
The five metrics on one page
The same five numbers, with the formula for each and what it signals. Worth saving and working through once by hand before letting any tool calculate them for you.
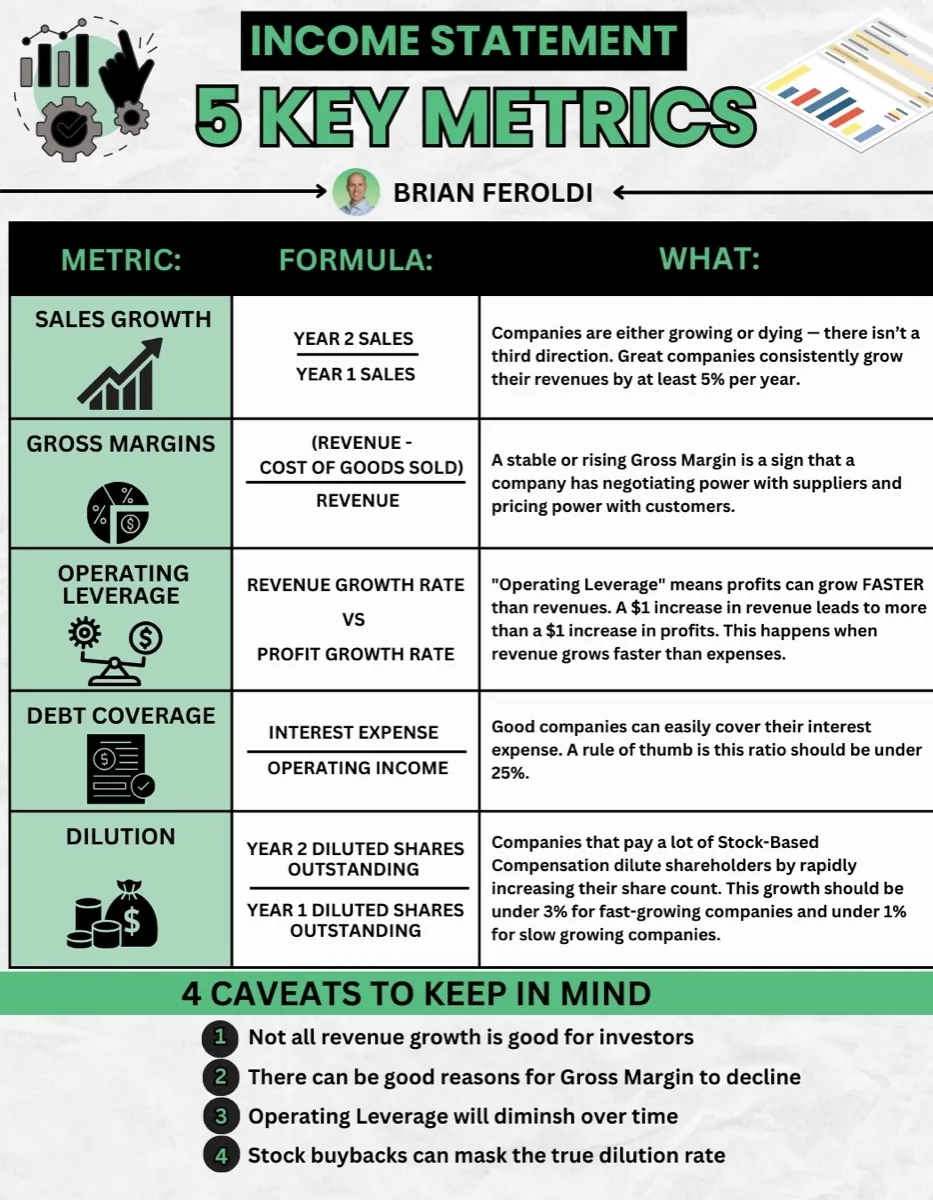
Four caveats
Each of these five metrics has a case where the obvious reading is the wrong one.
- Not all revenue growth is good for investors. Growth funded by issuing shares or by acquiring businesses at bad prices can raise revenue while lowering what each share is worth.
- Gross margin can decline for good reasons. A fast-growing lower-margin segment pulls the blended margin down while adding more absolute profit than it costs. Check the mix before concluding pricing power has weakened.
- Operating leverage diminishes over time. Once fixed costs have been spread, margins plateau. A company that expanded margins for a decade will not do so forever, and expecting it to is how growth forecasts break.
- Buybacks can mask the true dilution rate. A flat share count can hide millions of shares issued to employees and repurchased with company cash. Read the cash flow statement to see how much was spent keeping the count flat.
See these five numbers read for you
Phase Check pulls the income statement for any of 10,000+ global stocks, works out where the growth and margin trends place it in the lifecycle, and names the one metric that matters most at that phase. A fast second opinion on what you just read by hand.
Try Phase Check freeNo credit card. One check without an account, unlimited with a free one.
Frequently asked questions
Related
- How to read a cash flow statement, the statement that is hardest to manipulate
- How to analyze a stock, the seven-step framework these numbers feed into
- The 5 phases of a company lifecycle, why the same numbers mean different things at different stages
- Investing glossary, plain-English definitions of every term used above