
Weighted average cost of capital is the blended cost of the money a company uses, with debt and equity weighted by how much of each it has. It is the return the business must earn to satisfy everyone who funded it, which makes it the hurdle every investment has to clear.
Why debt looks cheaper than equity
Lenders are paid before shareholders and usually hold security, so they accept a lower return. Interest is also tax-deductible, which reduces the cost again: a company paying 8% on its debt at a 25% tax rate is really paying 6%.
Equity has no such protection. Shareholders are paid last and can lose everything, so they demand more. That is why the cost of equity is almost always the larger number, and why a company with no debt has a higher WACC than an identical one with some.
Worked example
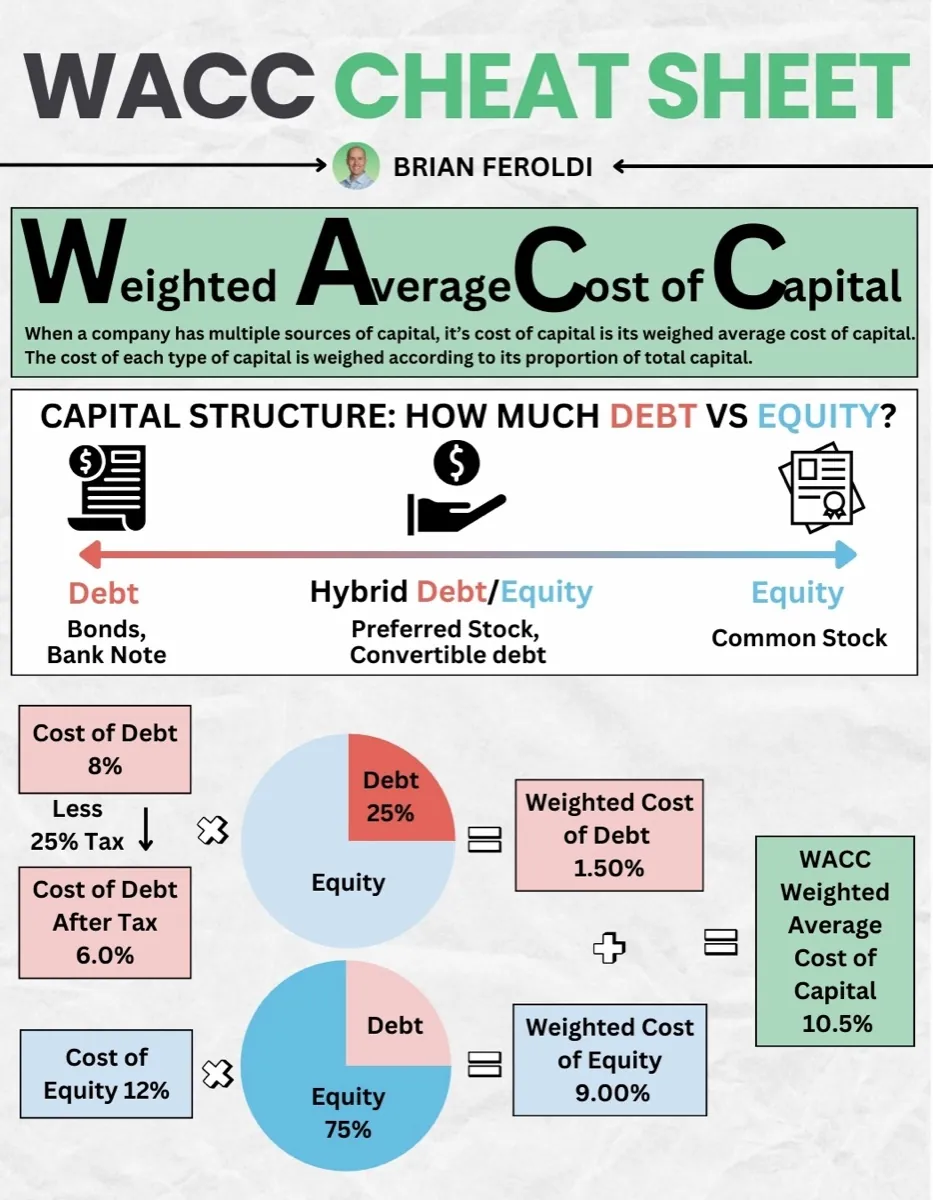
A company is funded 25% by debt and 75% by equity. Its debt costs 8% before tax, its tax rate is 25%, and shareholders require 12%.
After-tax cost of debt = 8% × (1 − 0.25) = 6.0%
Weighted cost of debt = 25% × 6.0% = 1.50%
Weighted cost of equity = 75% × 12.0% = 9.00%
WACC = 1.50% + 9.00% = 10.5%
Every project this company funds has to return more than 10.5% before it has created anything.
The only comparison that matters
WACC on its own tells you very little. Set against return on invested capital it tells you almost everything.
ROIC above WACC means each dollar the company invests returns more than it cost to raise, so growth creates value and more growth creates more of it. ROIC below WACC inverts that completely: every additional dollar invested destroys value, and a company growing fast in that state is destroying value faster. This is the single most useful thing WACC is for.
Why the number is softer than it looks
The cost of debt is close to observable, from the interest actually paid. The cost of equity is not observable at all. It is usually estimated with the capital asset pricing model, which needs a risk-free rate, an equity risk premium and a beta, and reasonable people disagree about all three.
Beta is the weakest link, since it measures historical share price volatility relative to the market and is treated as though it measured business risk. Those are not the same thing, and a stable business whose shares happen to swing around will be assigned a higher cost of capital than its economics deserve.
Small changes, large consequences
Because WACC is the discount rate in a discounted cash flow, a one-point change moves the valuation substantially, and further the longer the forecast. That sensitivity is the main practical argument for running a reverse DCF instead: rather than choosing a discount rate and defending the output, you take the price and read what the market has already assumed.
The honest way to use WACC is as a range rather than a figure. If a company clears 12% comfortably and your estimate lands anywhere between 8% and 10%, the conclusion holds whichever end is right, and that is a far more robust position than a decimal place.
The calculation on one page
The capital structure it weighs, and the same worked example laid out visually from cost of debt and cost of equity through to the blended figure.
When WACC is worth calculating
A hurdle rate is only useful when there is something to compare it against. A company with no profits has no return on capital to set beside it, which is why WACC belongs to the later phases.
The comparison WACC exists for
WACC only means something next to return on invested capital, and that comparison only means something once a company is generating returns at all. Phase Check places any of 10,000+ global stocks on the lifecycle and names the metric worth watching where it sits.
Try Phase Check freeNo credit card. One check without an account, unlimited with a free one.
Frequently asked questions
Related
- DCF calculator, see how much the discount rate moves the answer
- ROIC, the number WACC exists to be compared against
- Intrinsic value, where WACC becomes the discount rate
- Reverse DCF, the way around WACC's sensitivity problem
- Investing glossary, every term used above, defined in plain English