
Return on assets measures how much profit a company generates from everything it owns. It is net income divided by average total assets. Unlike ROE it ignores how those assets were financed, and unlike ROIC it includes assets that are not productively employed.
Where it sits between the other two
The three return metrics differ only in what goes in the denominator, and ROA takes the widest view. ROE counts only shareholders' money, so borrowing inflates it. ROA counts every asset regardless of who funded it, which removes that distortion. ROIC narrows again to capital actually employed in operations, excluding surplus cash.
That middle position is ROA's use and its limitation. It cannot be gamed with leverage, and it punishes a company for holding cash it has not yet deployed, which is not really a failure of the business.
Worked example
A company earns $120M. Total assets were $1,400M at the start of the year and $1,600M at the end, and $400M of the closing balance is surplus cash.
Average assets = ($1,400M + $1,600M) ÷ 2 = $1,500M
ROA = $120M ÷ $1,500M = 8.0%
Excluding surplus cash: $120M ÷ $1,100M = 10.9%
Nearly three points of difference, produced entirely by cash the company has not spent. Use average assets rather than the closing balance, or a year of growth distorts the figure on its own.
What counts as good
Entirely industry-dependent, more so than for the other return metrics, because asset intensity varies so widely. Above 5% is respectable for most, and software companies routinely exceed 15% while banks and utilities operate in low single digits by the nature of their balance sheets.
Comparing ROA across industries produces nonsense. Comparing it between direct competitors, where asset bases are structurally similar, is where it earns its place.
Where ROA is the right tool
- Banks and financial institutions. Assets are the business, and ROA is a standard industry measure. Around 1% is typical for a bank, which would be alarming almost anywhere else.
- Asset-heavy comparisons. Two manufacturers or two retailers with similar asset profiles compare fairly on ROA in a way they may not on ROE.
- Spotting deteriorating efficiency. A falling ROA while revenue grows means the company is adding assets faster than it is adding profit, which usually precedes trouble.
Two things it gets wrong
Intangible-heavy businesses. A company whose value is brand, code or network shows very few assets on the balance sheet, so ROA looks spectacular without describing anything. The metric assumes the balance sheet captures what the business runs on, which for modern companies is often false.
Depreciated assets. An older factory carried near zero book value produces a flattering ROA compared with a competitor who has just built a new one, even though the newer plant may be far more productive. Age of asset base distorts the comparison in ways nothing on the income statement reveals.
ROA against the three metrics it sits between
Each formula, when it is the right tool, and what distorts it.
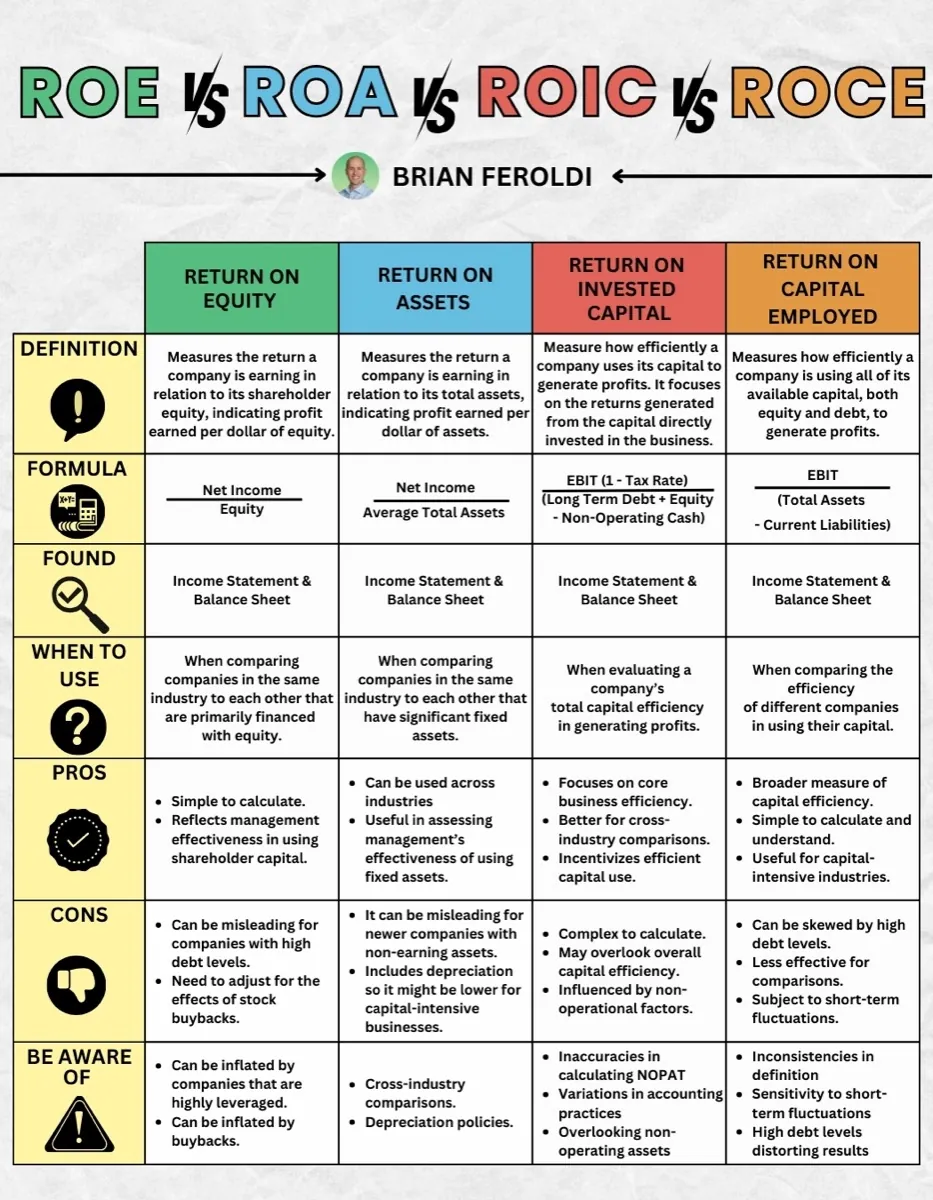
Return metrics need returns to measure
ROA is meaningless for a company that is not yet profitable, which covers most of the first two lifecycle phases. Phase Check places any of 10,000+ global stocks on the curve and names the metric that matters where it sits.
Try Phase Check freeNo credit card. One check without an account, unlimited with a free one.
Frequently asked questions
Related
- ROIC, the narrower measure that excludes idle capital
- ROE, the same question with leverage left in
- ROIC vs ROE, which of the two to trust and when
- How to read a balance sheet, where the asset figure comes from