
ROE divides profit by shareholders' equity. ROIC divides after-tax operating profit by debt and equity together. The difference is the denominator, and it decides everything: ROE can be raised by borrowing, while ROIC cannot. ROIC measures the business, ROE measures the business plus its financing.
The one difference that matters
Both ask how much profit a company makes per dollar of capital. They disagree about which dollars count.
ROE counts only the owners' money. So if a company borrows and uses the proceeds to buy back stock, equity falls, the denominator shrinks, and ROE rises. Nothing about the operations improved and the company is now riskier. ROIC counts every dollar the business uses regardless of source, which closes that door completely.
Where they diverge
Two companies each earn $80M of after-tax operating profit. Company A is funded entirely by $800M of equity. Company B has $300M of equity and $500M of debt, and after interest its net income is $62M.
A: ROE = $80M ÷ $800M = 10.0% ROIC = $80M ÷ $800M = 10.0%
B: ROE = $62M ÷ $300M = 20.7% ROIC = $80M ÷ $800M = 10.0%
Identical businesses. ROE says B is twice as good. ROIC says they are the same, which is the truth, and B carries risk A does not.
When to use each
- Use ROIC by default. For comparing companies, for judging business quality, and for anything where capital structures differ. It is the number that survives the comparison.
- Use ROE for banks and insurers. There, leverage is the business rather than a financing choice, and the balance sheet is the product. ROIC is not well defined for them.
- Use both together as a diagnostic. A wide gap between a high ROE and an ordinary ROIC is a leverage story, and it tells you more than either number alone.
The comparison that actually decides
Neither number means anything without a benchmark. ROIC has one built in: the weighted average cost of capital. Above it, growth creates value. Below it, growth destroys value, and a company growing fast under that line is destroying it faster.
ROE has no equivalent benchmark that is not itself distorted by leverage, which is a second and less discussed reason to prefer ROIC when you have the choice.
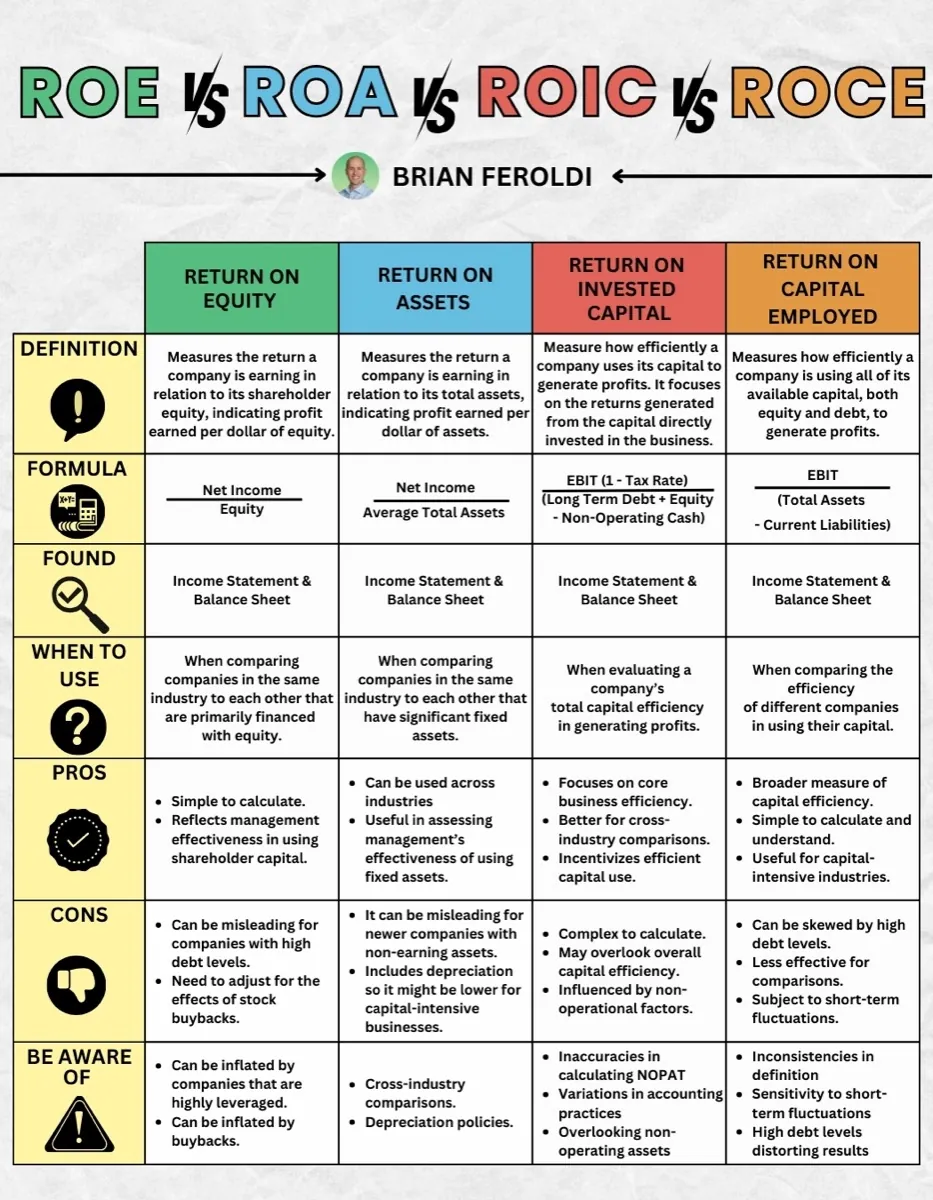
All four return metrics side by side
ROIC and ROE alongside ROA and ROCE, with each formula, when it is the right tool, and what distorts it.
Return metrics only matter once there are returns
Both ratios are meaningless for a company that is not yet profitable, which is most of the first two lifecycle phases. Phase Check places any of 10,000+ global stocks on the curve and names the metric that matters where it actually sits.
Try Phase Check freeNo credit card. One check without an account, unlimited with a free one.
Frequently asked questions
Related
- ROIC, the full guide, including four ways it misleads
- ROE, and the three ways it can be manufactured
- WACC, the benchmark that makes ROIC meaningful
- Investing glossary, every term used above, defined in plain English